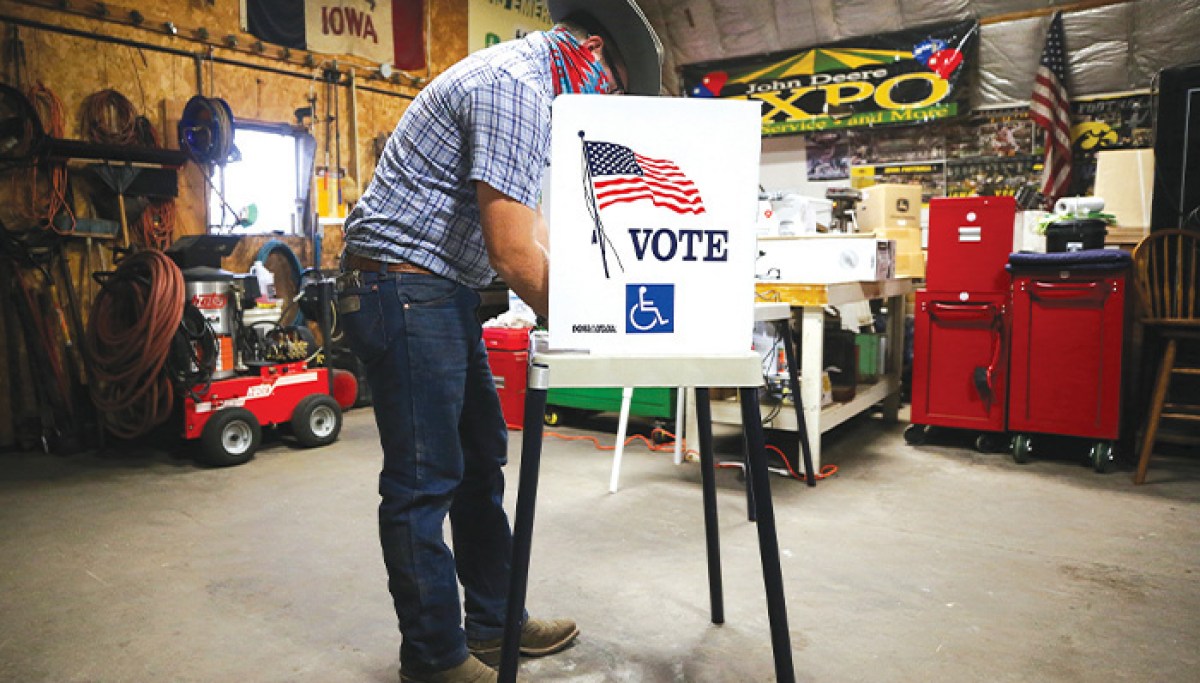
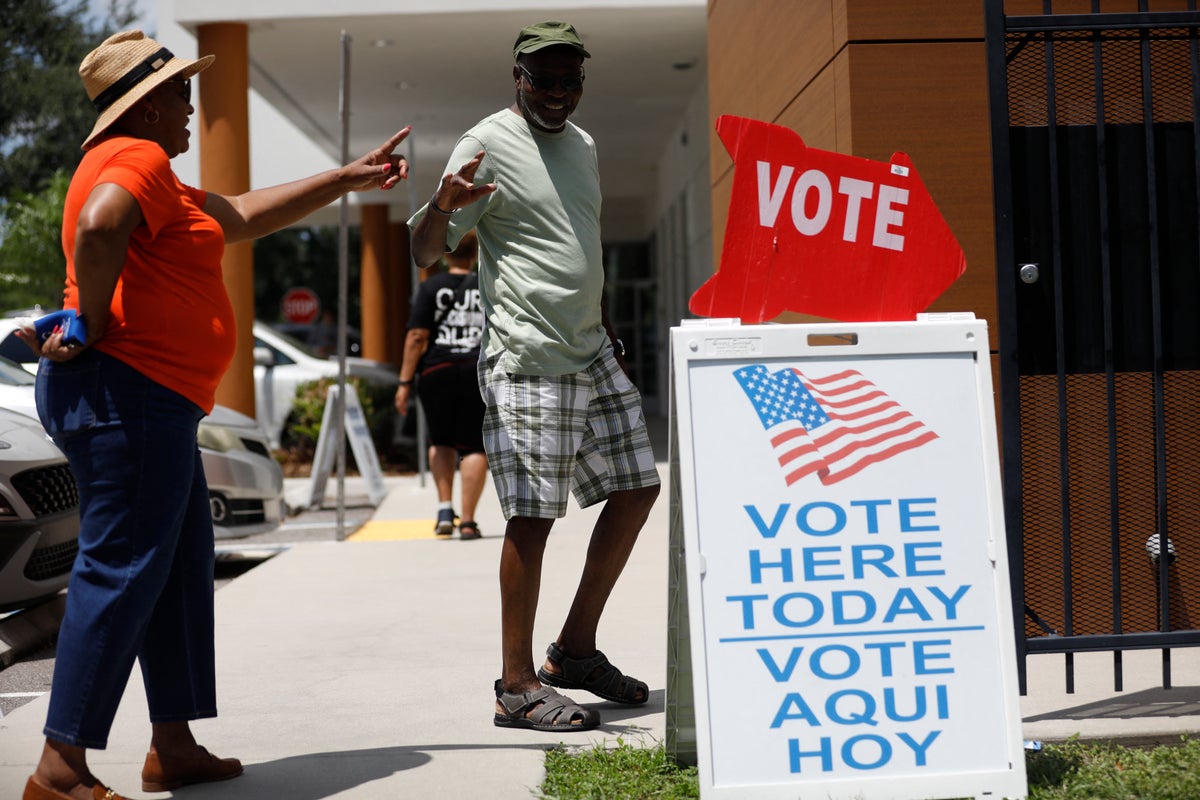
As Election Day approaches, pollsters spend a lot of time trying to figure out who is going to vote and who will stay home.
asserted
who → approach → time
Public pollsters are tightening their screening techniques, moving from all-adult samples to registered voters and likely voters, using lists of actual voters and their own models to tell us what they think the 2026 electorate will look like.
asserted
electorate → tighten → what
The task is crucial for pollsters because when people are asked about voting, many people respond, “Of course I’m going to vote.”
asserted
I → ask → voting
In an early September CBS News/YouGov poll of registered voters, 78% told the pollsters they would definitely vote in November, and another 12% said they probably would.
asserted
they → register → November
In the last off-year election, 46% of eligible voters turned out.
asserted
% → turn → voters
Thus far for the 2026 elections, Democrats tell pollsters they are more enthusiastic about voting this fall than Republicans, often by significant margins.
asserted
they → tell → margins
In the CBS/YouGov poll, 59% of Democrats said they were very enthusiastic compared with 48% of Republicans.
asserted
they → say → Republicans
We also know Democratic unity is stronger, with significant dissatisfaction among some Republicans.
asserted
unity → know → Republicans
In the new New York Times/Sienna poll, 32% of Republican likely voters said they disapproved of President Donald Trump’s handling of the cost of living.
asserted
they → say → living
Nineteen percent of them disapproved of his handling of tariffs, 18% the economy, 14% immigration, and 20% the war in Iran.
asserted
percent → disapprove → Iran
Will these lukewarm Republicans vote for GOP candidates this fall, or will they just stay home?
asserted
they → vote → candidates
We’ll see.
asserted
We → see → ?
In a post-election poll in 2024, when Pew asked about people’s participation in the 2020, 2022, and 2024 elections, 12% of age-eligible voters said they had voted in 2024 only and 55% of this group voted for Trump, with 41% for Harris.
asserted
% → ask → Harris
(The 64% of voters who voted in all three elections split their votes evenly — 50% for Trump and 48% for Harris.
asserted
who → vote → Harris
Were the low-propensity voters drawn to Trump personally, or were they simply rejecting the Biden presidency status quo?
asserted
they → draw → presidency
Or did they simply dislike Kamala Harris?
asserted
they → dislike → Harris
Whatever the reason, Trump made impressive gains in 2024 among working-class, Hispanic, and male voters.
asserted
Trump → make → voters
When the president says, “Pretend I’m on the ballot,” he is channeling these occasional voters.
asserted
he → say → voters
Will they vote for Republicans once again?
asserted
they → vote → Republicans
In a new Fox News poll, 50% of registered voters with incomes below $50,000 (a proxy for the working class) said they would be less likely to vote for a candidate endorsed by him (28% more).
asserted
they → register → %
We’ll see.
asserted
We → see → ?
Pollsters have tried for decades to understand people who never vote.
asserted
who → try → people
Pew reported that 26% had not voted in 2020, 2022, or 2024.
asserted
% → report → 2020
In an extensive ABC News poll from 40 years ago, likely and unlikely voters did not perceive “major logistical obstacles either in registration or election processes.”
asserted
voters → perceive → registration
That hasn’t changed, and ballot access isn’t a big problem, as many Democrats suggest.
asserted
Democrats → change → ?
After every election, the Census asks voters whether they are registered and whether they voted.
asserted
they → ask → voters
They also ask those people who say they didn’t vote: Why?
asserted
they → ask → people
In 2022, the top reason was “too busy or schedule conflicts” followed by 18% who were “not interested.”
asserted
who → follow → %
Eight percent said they forgot to vote.
asserted
they → say → ?
Only 2% said either registration problems, inconvenient polling places, or transportation problems were reasons they didn’t show up.
asserted
they → say → ?
In a YouGov poll taken immediately after the 2022 election, the top reason for those who didn’t vote was a dislike of the candidates (52%), followed by 48% who said they didn’t think their vote would matter, and another 48% who said they were too busy.
asserted
they → take → %
In Pew’s 2024 post-mortem, a large majority of nonvoters said they didn’t wish they had voted in that election.
asserted
they → say → election
The data seem to suggest that there are just a lot of people who don’t like politics, leading ABC to conclude that “for many Americans, nonvoting is as American as apple pie.”
asserted
nonvoting → seem → pie
Conventional wisdom suggests Democrats will regain control of the House, while opinion is divided about the Senate.
uncertain
opinion → suggest → Senate
 The Aporia