Photo via The Sydney Morning Herald

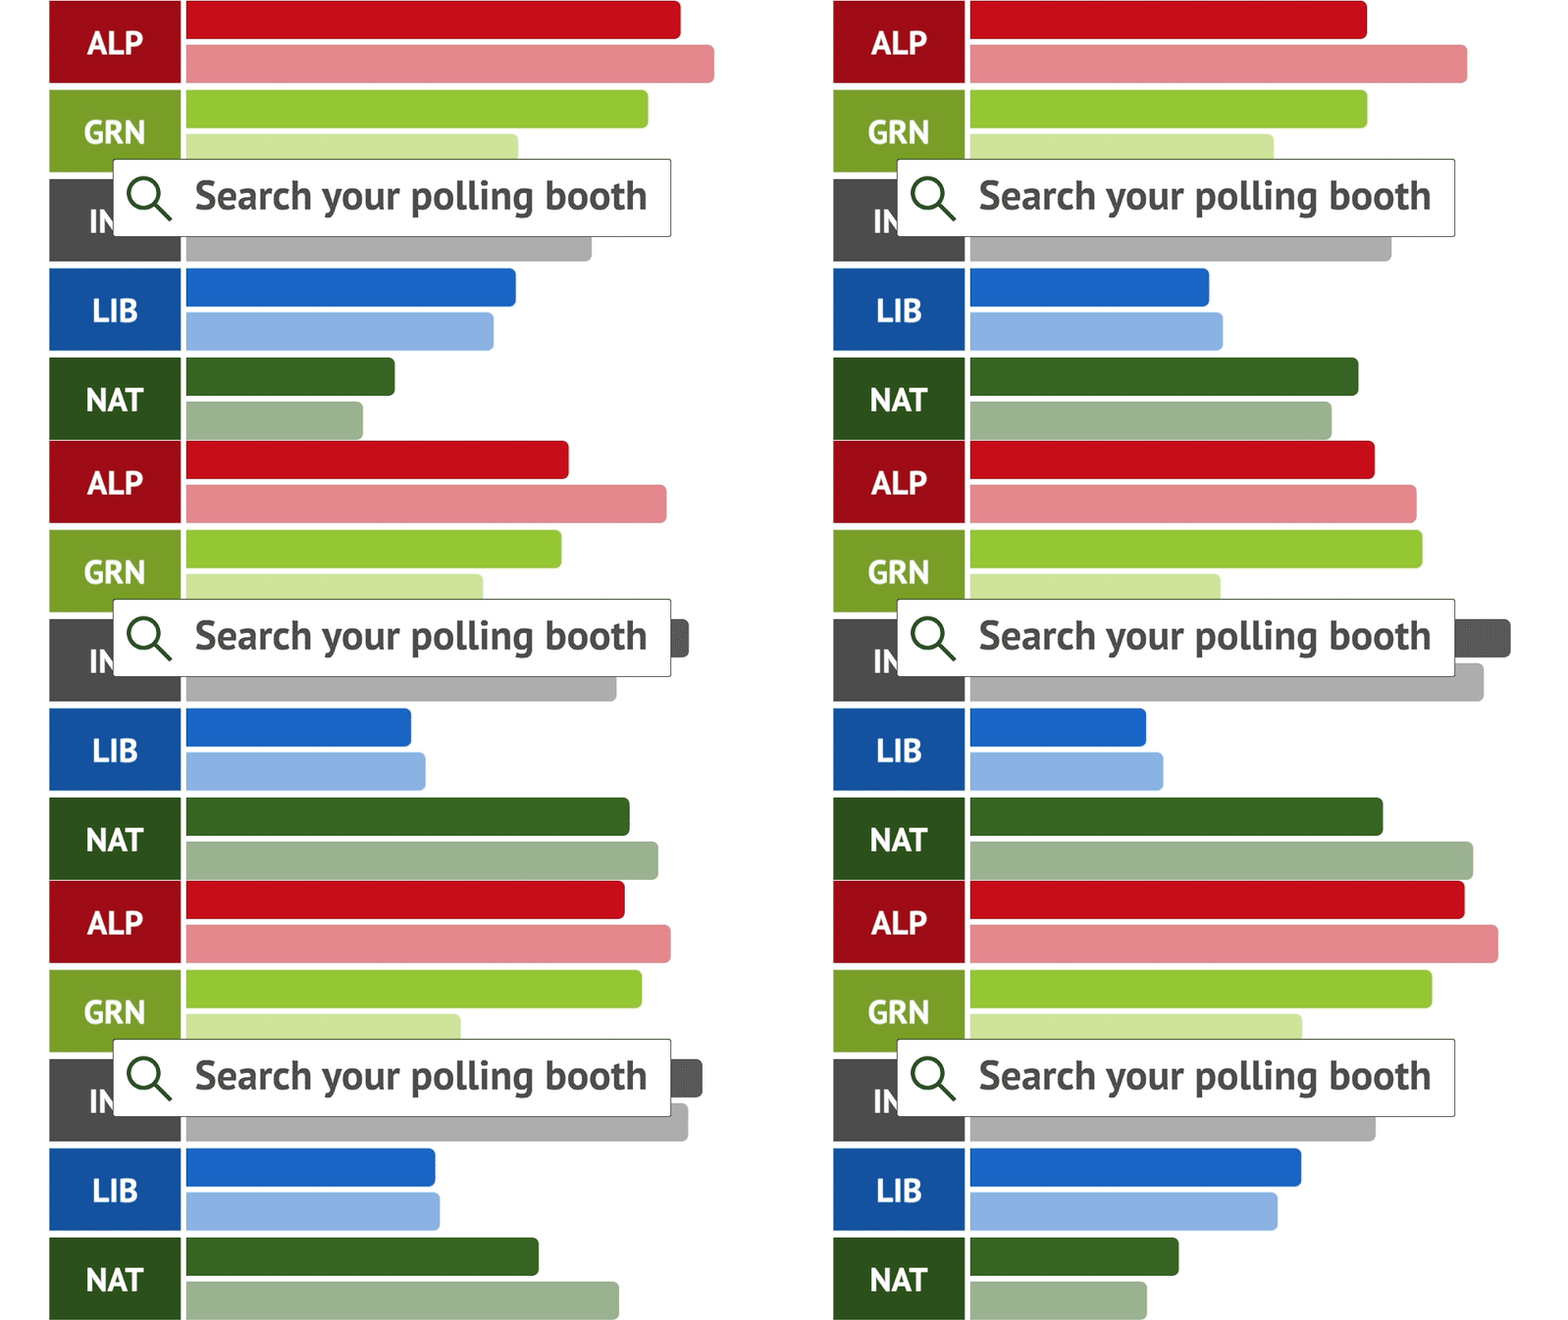
What do people in Melbourne in your area, in your age group, earn?

Read the original at The Sydney Morning Herald ↗
Cite

Butt, C., Wade, M., & Scott, N. (2026, October 11). What do people in Melbourne in your area, in your age group, earn? The Sydney Morning Herald. https://www.smh.com.au/national/victoria/what-do-people-in-melbourne-in-your-area-in-your-age-group-earn-20261011-p611fb.html?ref=rss&utm_medium=rss&utm_source=rss_feed

Dated when The Aporia collected the article, usually within hours of publication. Check the original for its exact date and byline.

The Sydney Morning Herald · collected 2026-10-11 · by Craig Butt, Matt Wade, Nathanael Scott

Quick Summary

The Age analyzes official income data to show how earnings vary by age and gender across Melbourne. For instance, males aged 45 to 54 earn the city's highest median income at $96,457 annually, while the overall Greater Melbourne median is $59,784. The interactive tool allows users to find median incomes for their specific area and age group. Notably, there is a persistent gender wage gap that widens with age; in Maribyrnong, the smallest income difference between men and women is 14%, while other areas show larger disparities.
Written by AI on 2026-10-11, from this article's own text only (the story summary below draws on all the coverage).

AI analysis

Story summary

In Melbourne, the median annual income is $59,784 for all residents in Greater Melbourne. However, men aged between 45 and 54 have the highest median income at $96,457, slightly above males aged 35 to 44 who earn $93,306 annually. The data reveals that earnings generally increase from early twenties and peak around ages 45-54 before declining. Women in the same age bracket as men (45-54) have a median income of $69,620, indicating a significant gender wage gap compared to their male counterparts. This analysis, based on official income data from The Age, also shows that housing affordability pressures are pushing higher-income households into traditionally blue-collar suburbs such as Coburg and Pascoe Vale, historically considered outside Melbourne’s white-collar areas.

Written for “Melbourne Earnings Survey” on 2026-11-04, grounded in this article and the 0 other(s) covering the same event.

Story

📰 Melbourne Earnings Survey
Economy/Business · 1 article(s) covering the same event.

Compared with similar articles

Nothing to compare against. No article is close enough to this one for the pipeline to have linked or judged the pair.
How this article was measured signals, leaning charts, publisher record, byline, topics and claims

Signals How these are calculated →

Claims extracted
30
sentences that state something as happening or true
Uncertain
7%
2 of 30 hedged ("reportedly", "may", "according to")
Leaning
withheld
no quote in the article backed the model's score
Publisher signals
61/100
The Sydney Morning Herald's corrections and hedging, across everything collected from it. Not a measure of accuracy.
Outlets on this story
1
Economy/Business
Same framing elsewhere
1
articles that frame the event the way this one does
Analyzed 2026-10-11 · how these are computed

How this is being covered How these are calculated →

Article leaning vs. publisher reliability
Source leaning vs. consistency

Publisher

The Sydney Morning Herald · 6052 article(s) · 15 correction(s) detected
Running correction rate · 15 correction(s)

Who wrote this

Craig Butt
8 article(s) here · 1 carrying a prediction
🔮 “It may well be that part of the frustration for parents is the transport to get their kids to school, and the traffic and the congestion.
🔮 If the polls are to be believed, law and order will be a decisive factor when voters decide on November 28 whether to turf Labor out.
🔮 If you looked at the figures for your area across several age brackets, you may have noticed how earnings track.
🔮 Education Minister Jason Clare said recent funding agreements would result in $20 billion flowing into public schools in coming decade under the needs-based Gonski funding model.
🔮 The Commonwealth has now agreed to fund 80 per cent of the SRS of non-government schools, while the states’ target is 20 per cent, but the transition back to their actual entitlement is being done in stages until 2029. Melbourne Grammar School will receive about $986,000 more than the SRS this year, $40,000 more than previous Senate estimates figures revealed.
🔮 A dialogue box will pop up in the interactive if you enter the name of a small school and flag that its performance may not be comparable with larger schools, and that it may not be possible to observe a trend in results over the 10-year time frame.
🔮 “The analogy I use is you don’t run onto the football field thinking about what the score will be at the end because if you do that, you’re not concentrating on the things that create the score.
Also by Craig Butt
What do Sydneysiders in your area, and age group, earn?
2026-10-04 · The Sydney Morning Herald
Nothing else under this byline is closely related to this article, so these are simply their most recent.
All 8 articles by Craig Butt →
Matt Wade
21 article(s) here · 1 carrying a prediction
🔮 But researchers say that figure would rise to about 45 per cent with closer analysis of Brisbane’s CBD and inner suburbs, including South Brisbane, Fortitude Valley, Newstead, Milton and Spring Hill, where knowledge-intensive services such as finance, professional services, and information technology are concentrated.
🔮 The Reserve Bank has already lifted interest rates four times this year to combat elevated inflation and is expected to deliver a fifth rate hike after its monetary policy board meets on Tuesday.
2026-11-02 · assertive framing · The reason why a rate rise will hurt Sydneysiders most
🔮 Sydney’s professional heartland is set to be reshaped by automation with hundreds of thousands of workers in the city’s inner suburbs more exposed to artificial intelligence-driven disruption than anywhere else in Australia.
2026-11-01 · assertive framing · The Sydney suburbs most exposed to AI disruption
🔮 Many aspiring home buyers will welcome the recent pullback in prices, although four interest rate hikes by the Reserve Bank this year, which has driven the downturn, have made it harder for new home borrowers to service a mortgage.
🔮 If not for a fall in the labour force participation rate – the share of people in work or looking for work – last month’s jobless rate in NSW would have been higher.
🔮 If you looked at the figures for your area across several age brackets, you may have noticed how earnings track.
🔮 “For the first time … ordinary Australians will be able to build a decent nest egg for their retirement,” said the then-Prime Minister.
2026-10-09 · assertive framing · Is Australia saving too much for retirement?
🔮 But the home building sector has this year been hit by a series of interest rate hikes, higher construction prices due to the Middle East war and uncertainty prompted by the May budget’s housing tax changes which are yet to properly flow through to the figures.
🔮 Households will face “recession-like” conditions next year, a leading forecaster has warned, as fresh evidence shows consumers are losing confidence in the economy amid growing cost-of-living pressures.
🔮 That followed hikes in February, March and May.
Also by Matt Wade
AI is coming for office workers. How vulnerable is Brisbane?
2026-11-02 · The Sydney Morning Herald
The reason why a rate rise will hurt Sydneysiders most
2026-11-02 · The Sydney Morning Herald
The Sydney suburbs most exposed to AI disruption
2026-11-01 · The Sydney Morning Herald
Nothing else under this byline is closely related to this article, so these are simply their most recent.
All 21 articles by Matt Wade →
Nathanael Scott
3 article(s) here · 1 carrying a prediction
🔮 Polls suggest the party will be banished to the opposition benches – and replaced by a government led by Wilson.
🔮 If you looked at the figures for your area across several age brackets, you may have noticed how earnings track.
Also by Nathanael Scott
What do Sydneysiders in your area, and age group, earn?
2026-10-04 · The Sydney Morning Herald
Nothing else under this byline is closely related to this article, so these are simply their most recent.

Topics

Brighton Greater Melbourne Hampton Melbourne The Age

Subjects

Melbourne GPE · 4× Greater Melbourne GPE · 2× Stonnington East GPE · 2× Black Rock GPE · 1× Brighton ORG · 1× CBD GPE · 1× Hampton PERSON · 1× Melbourne City ORG · 1× Sandringham GPE · 1× The Age ORG · 1×

Narrative

He said the “hipster-proof fence” of Bell Street historically marked the northern edge of Melbourne’s white-collar areas, “but housing affordability pressures are now pushing higher-income households into traditionally blue-collar suburbs such as Coburg and Pascoe Vale”. But it should be noted that the difference between the median incomes of 35-44 year-olds and 45-54 year-olds is very slim in most areas - usually no more than 3 per cent either way – so the data does not suggest that there are large income disparities between these two age brackets.
framing: assertive · carried by 1 article(s) · first seen 2026-10-11
🔮 If you looked at the figures for your area across several age brackets, you may have noticed how earnings track.
2026-10-11 · The Sydney Morning Herald
What do people in Melbourne in your area, in your age group, earn? · assertive framing

Claims (30 extracted, 2 hedged)

For workers in Melbourne, it pays to be a bloke aged between 45 and 54. asserted
it → pay → 45
Men in that age group have the city’s highest median income at $96,457 a year, a little more than the next highest group (males aged 35 to 44 at $93,306). asserted
Men → have → 93,306
Analysis of official income data by The Age sheds light on how earnings vary by age and sex across the city. asserted
earnings → shed → city
Using the interactive below, you can find out the median income for your age group in your area, broken down by sex: asserted
you → use → sex
If you looked at the figures for your area across several age brackets, you may have noticed how earnings track. uncertain
earnings → look → brackets
Median incomes for both men and women start comparatively low in their early twenties, before rapidly increasing and typically peaking at around 45-54 years old. asserted
incomes → start → twenties
For both men and women across the city, 45-54 year-olds had the highest median income in 2022-23 (the most recent year for which this data is available), at $96,547 for men and $69,620 for women. asserted
data → have → women
The data covers only individual pre-tax income from wages, investments, self-owned businesses and (if applicable) superannuation; it does not include assets owned by individuals such as housing and shares. asserted
it → cover → housing
Also, it doesn’t distinguish between part-time and full-time workers, which is one factor in the gap between men and women, since women are more likely to work part-time than men. asserted
women → distinguish → men
The area with the highest median income is Bayside, which includes Brighton, Hampton, Sandringham and Black Rock, where half of income earners raked in at least $86,879 in 2022-23. asserted
half → include → 2022
The Melbourne City area, including suburbs such as the CBD, Docklands, Port Melbourne and Parkville, had the lowest median income, at $48,382. asserted
area → include → 48,382
This is partly because the city is home to large numbers of younger people and university students who are predominantly working part-time and in entry-level jobs, which drives down the median. asserted
which → work → median
How does your income stack up? asserted
income → stack → ?
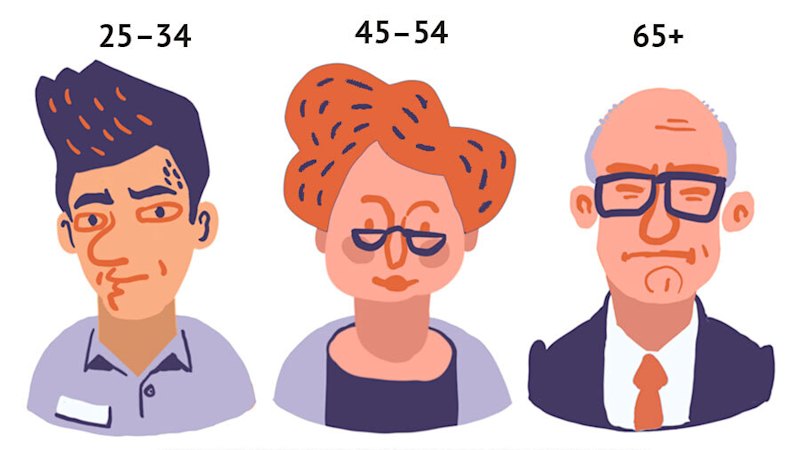
The age and gender breakdown of Melbourne In every Melbourne area and in every age bracket, men have a higher median income than women, and the gap widens with age. Rae Cooper, professor of gender, work and employment relations at the University of Sydney, said women shoulder much more unpaid domestic work during “the prime working years” in their 30s and 40s when family care is most intense. “This can constrain their participation, working hours and career choices, contributing to a ‘motherhood penalty’ in pay,” she said. asserted
she → have → pay
“A gender income gap that persists and widens through working life leads to the gender wealth gap, affecting women’s economic security not only today but across their entire lifetime and into retirement.” asserted
that → persist → retirement
The area of Maribyrnong, which takes in suburbs such as Footscray and Yarraville, has the smallest total income gap between men and women, with a 14 per cent difference. asserted
which → take → difference
The biggest gap was in Macedon Ranges, which encompasses suburbs such as Gisborne and Riddells Creek, where there was a 59.2 per cent difference between the median income of men and women. asserted
which → encompass → men
The highest median income of any age bracket and sex is men aged 45-54 in Stonnington East, who have a median income of $169,670. asserted
who → have → 169,670
Stonnington East includes the suburbs of Malvern, Malvern East and Glen Iris. asserted
East → include → Malvern
That’s far higher than the median for all people in the area, of $82,689. asserted
That → ’ → 82,689
There are 40 areas that make up Greater Melbourne. asserted
that → be → Melbourne
In 28 of them, 45-54 year-old men have the highest median income and in 12 it is 35-44 year-old men. asserted
it → have → 12
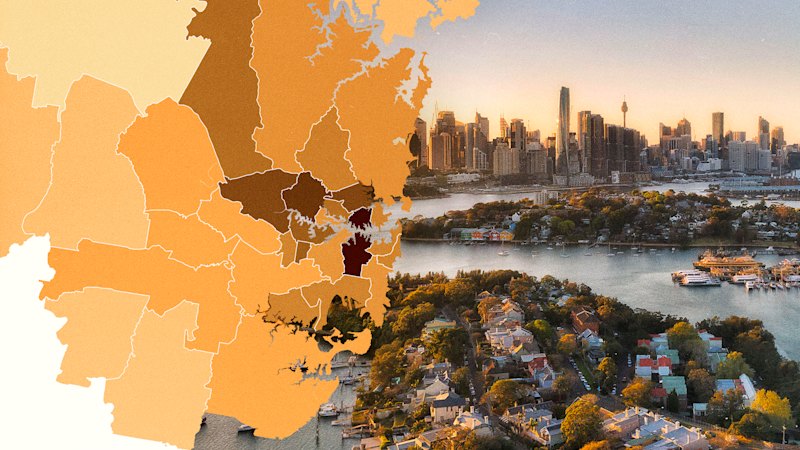
The areas on the map where 35-44 year-old men have the highest median income are typically growth corridors or outer suburbs, while 45-54 year-olds are the higher earners in the inner city and leafy eastern suburbs. asserted
olds → have → city
Why the ‘hipster-proof fence’ in Melbourne is shifting asserted
fence → shift → Melbourne
Demographer Matthew Deacon of Demographic Solutions said the outer suburban areas where 35-44 year-olds were the highest income earners were home to a large number of blue-collar workers who rely more on physical labour, and who reach peak earnings earlier in life, during the 35-44 window. asserted
who → say → window
KPMG urban economist Terry Rawnsley said that in the western and northern growth corridors, and in areas such as Keilor and Moreland North, a much larger share of new 35-44 year-old residents were white-collar professionals who had been priced out of the inner suburbs. asserted
who → say → suburbs
He said the “hipster-proof fence” of Bell Street historically marked the northern edge of Melbourne’s white-collar areas, “but housing affordability pressures are now pushing higher-income households into traditionally blue-collar suburbs such as Coburg and Pascoe Vale”. But it should be noted that the difference between the median incomes of 35-44 year-olds and 45-54 year-olds is very slim in most areas - usually no more than 3 per cent either way – so the data does not suggest that there are large income disparities between these two age brackets. asserted
data → say → brackets
The areas with the biggest difference between the median income of 45-54 year-old men and 35-44 year-old men were the affluent areas of Stonnington East, Boroondara (which takes in suburbs such as Balwyn, Camberwell, Hawthorn and Kew) and Bayside, where the median income of 45-54 year-olds is more than 20 per cent higher than that of 35-44 year-olds. asserted
income → take → olds
Deacon said this could be because these areas are home to a large number of senior managers and business owners who have reached the peak of their careers and who could afford to buy property in these expensive suburbs. uncertain
who → say → suburbs
In addition, he said these areas are also home to legal and medical professionals who spend longer in education and training, and so reach their highest income levels later in life. asserted
who → say → life

💬Give feedback
🕘History 🎫Support